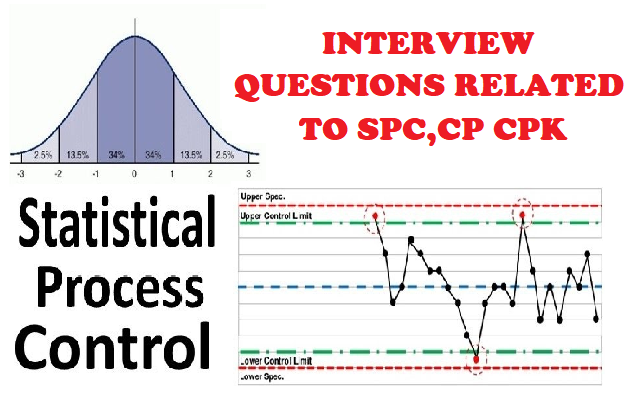
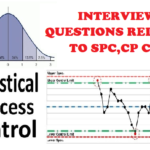
Statistical Process Control (SPC) and process capability indices (Cp, Cpk, Pp, Ppk) are crucial for maintaining and improving quality in manufacturing. Here are some common interview questions and answers on these topics, including explanations and calculations.
1. Can you explain what Statistical Process Control (SPC) is and why it’s important in manufacturing?
- Answer: SPC is a method of monitoring and controlling a process through statistical tools to ensure the process remains stable and produces consistent, high-quality output. It’s important in manufacturing because it helps detect variations, identify root causes of quality issues, and maintain product consistency, ultimately reducing waste and costs.
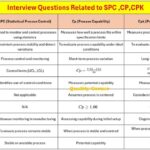
2. What is the difference between Cp and Cpk? How do you calculate each?
- Answer: Cp (Process Capability Index) measures the potential capability of a process by comparing the spread (variation) of the process to the specification limits. Cpk (Process Capability Index adjusted for centering) considers both the spread and the centering of the process relative to the specification limits.
- Formula:
- Cp = (USL – LSL) / (6 * σ), where USL is the Upper Specification Limit, LSL is the Lower Specification Limit, and σ is the process standard deviation.
- Cpk = min[(USL – μ) / (3 * σ), (μ – LSL) / (3 * σ)], where μ is the process mean.
3. How are Pp and Ppk different from Cp and Cpk? When would you use Pp and Ppk instead?
- Answer: Pp and Ppk are similar to Cp and Cpk but are used to measure preliminary process capability based on a limited data set (e.g., initial production runs) rather than long-term data. Pp and Ppk are often used during process setup or pilot runs, while Cp and Cpk are used when the process is stable and fully operational.
4. When is Cp = Cpk?
- Answer: Cp equals Cpk when the process mean is exactly centered between the upper and lower specification limits. In this case, the process is well-centered, and its spread matches the specification limits.
5. What does a Cp value greater than 1 signify about a process?
- Answer: A Cp value greater than 1 indicates that the process variation is smaller than the specification limits, meaning the process has the potential to meet specifications consistently if it is centered within those limits.
6. If a process has a Cpk = 1.33, what does that indicate about its capability?
- Answer: A Cpk value of 1.33 generally indicates that the process is capable and has a buffer of about four standard deviations from the nearest specification limit. Many industries accept a Cpk of 1.33 as capable, indicating a low chance of producing out-of-spec products.
7. If Cpk = Ppk, what does it signify?
- Answer: If Cpk equals Ppk, it suggests that the process is stable and in control with minimal special cause variation. This equality indicates that the short-term and long-term capabilities are aligned, which is a good sign of consistent process performance.
8. Why might there be a difference between Cp/Cpk and Pp/Ppk values? What could this tell you about the process?
- Answer: A difference between Cp/Cpk and Pp/Ppk values can indicate that the process is not stable or in control. Cp/Cpk assumes a stable process, while Pp/Ppk does not. If Pp/Ppk values are significantly lower, it may mean the process has been subject to special cause variations during the period.
9. What does a negative Cpk value indicate?
- Answer: A negative Cpk value indicates that the process mean is outside the specification limits, resulting in a high likelihood of producing defective parts. This means that the process is significantly off-target and needs immediate corrective action.
10. If almost all readings are within the 1 σ line, what will be the approximate Cpk value?
- Answer: If almost all readings are within 1 sigma (one standard deviation from the mean), the process variation is very tight relative to the specification limits. This situation could result in a very high Cpk value, often greater than 2, indicating an extremely capable process with minimal variation.
11. How do you interpret a Cpk value of less than 1 ? What actions would you take in this situation?
- Answer: A Cpk value of less than 1 indicates that the process is not capable of consistently meeting specifications. I would investigate and identify the root causes of variation, adjust the process parameters if possible, and implement controls to reduce variability.

12. Why is Cpk referred to as short-term capability, while Ppk is called long-term capability?
- Answer: Cpk is calculated using within-sample variation, reflecting the process’s short-term performance under controlled conditions. Ppk, on the other hand, incorporates total variation, including both short-term and long-term variations, thus providing a more realistic measure of the process’s performance over an extended period.
13. Describe how control charts are used in SPC and give examples of different types of control charts.
- Answer: Control charts are used to monitor process stability by plotting data points over time and comparing them to control limits. Examples include the X-bar and R chart (for subgroup means and ranges), I-MR chart (for individual data points), p-chart (for proportion of defects), and c-chart (for count of defects).
14. What are the key differences between control limits and specification limits in SPC?
- Answer: Control limits are statistical boundaries calculated from process data to monitor stability and detect unusual variation. Specification limits are customer-defined boundaries that represent the acceptable range for the product. Control limits focus on process control, while specification limits focus on meeting customer requirements.
15. If a process shows a high Cp but a low Cpk, what could this mean?
- Answer: A high Cp and low Cpk suggest that the process has low variation (good potential capability) but is not centered within the specification limits. This indicates the need for centering the process mean to reduce the risk of producing out-of-spec parts.
16. How do you use SPC data to identify and correct process variability?
- Answer: SPC data is plotted on control charts to detect patterns and trends that indicate variations. If special cause variations are detected, I investigate the causes and implement corrective actions, such as adjusting equipment, modifying procedures, or retraining operators.
17. Can you explain the significance of normal distribution in SPC and process capability analysis?
- Answer: Normal distribution is significant in SPC because many process capability calculations, such as Cp and Cpk, assume normality in process data. A normal distribution allows us to predict process behavior and calculate the likelihood of out-of-spec products.
18. Describe the steps you would take to improve a process with low Cp or Cpk values.
- Answer: To improve a process with low Cp or Cpk, I would:
- Conduct a root cause analysis to identify sources of variation.
- Implement corrective actions to reduce variation.
- Monitor the process using control charts to verify improvements.
- Continue adjusting and monitoring until the Cp and Cpk values meet acceptable levels.
19. What is the minimum Cpk value generally required for a process to be considered capable in a high-quality industry?
- Answer: In many high-quality industries, a minimum Cpk of 1.33 is often required. Some industries, such as automotive, may require Cpk values of 1.67 or higher for critical processes.
20. How do you calculate control limits for a control chart?
- Answer: Control limits are typically calculated as follows:
- For X-bar and R charts, control limits are based on the average and range of subgroups, often using a formula like X-bar ± A2 * R for X-bar charts.
- For I-MR charts, the individual values’ mean ± 3 * standard deviation of moving ranges is used.
21. Explain what special cause and common cause variations are and how they affect process control.
- Answer: Common cause variation is the inherent, natural variability within a process, while special cause variation is an unexpected fluctuation due to external factors. Common cause variation indicates a stable process, whereas special cause variation requires immediate investigation to restore control.
22. What type of data is suitable for an X-bar and R chart versus an individual/moving range (I-MR) chart?
- Answer: X-bar and R charts are suitable for subgrouped data (e.g., averages of samples). I-MR charts are suitable for individual measurements, especially when collecting subgrouped data is impractical or infeasible.
23. How would you explain the meaning of Ppk = 0.8 to a non-technical audience?
- Answer: A Ppk of 0.8 means that the process is not very consistent in meeting customer requirements. There’s a high chance of producing products that fall outside the acceptable range, indicating that improvements are needed.
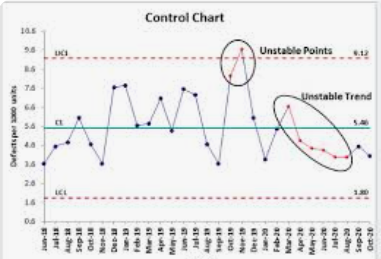
24. What would you do if you observed a trend or shift in the control chart? How do you respond to this in SPC?
- Answer: If I observe a trend or shift, it suggests a change in the process that may be due to a specific cause. I would investigate the recent changes in materials, methods, or machinery, identify the root cause, and make necessary adjustments to restore process stability.
25. How would you approach a scenario where Cpk values fluctuate significantly over time?
- Answer: Significant fluctuations in Cpk values over time indicate that the process is unstable and affected by varying sources of special cause variation. My approach would involve:
- Data Analysis: I would examine control charts and historical data to identify patterns or trends in the Cpk fluctuations.
- Root Cause Analysis: Investigate potential causes such as equipment variability, operator changes, material inconsistencies, or environmental factors.
- Corrective Actions: Address identified issues by implementing solutions, such as maintenance, retraining, or supplier quality improvements.
- Monitoring: Continuously monitor the process with SPC tools to verify that the corrective actions are effective and maintain stability over time. This approach ensures that we systematically address the variability sources, resulting in a more stable and capable process.
26. When we say that the process is statistically in control ?
When we say that a process is statistically in control, it means that the process operates within the expected range of variability and exhibits only common causes of variation. These common causes are inherent to the system and are consistent over time. In other words, the process is stable and predictable, and no unusual events (also called special causes of variation) are affecting the output.
Indicators that a process is statistically in control include:
- Control charts showing data points within the upper and lower control limits.
- No significant patterns, trends, or shifts in the process data.
- Variation stays random and within the set control limits, with no outliers or sudden jumps.
When a process is in control, it allows businesses to predict performance and ensure that products or services meet consistent quality standards. However, being in control doesn’t guarantee that the process meets customer specifications—it only indicates that the process is stable.
27. What 8 Rule to identify Special Cause in Control Chart
Control chart trend rules help detect non-random patterns or special causes of variation within a process. If these rules are triggered, it indicates the process may be out of statistical control. Here are the key rules often used:
1. Point Outside Control Limits
- Rule: One point falls outside either the upper control limit (UCL) or lower control limit (LCL).
- Meaning: A special cause is affecting the process.
2. Run of 7 (or more) Consecutive Points on One Side of the Mean
- Rule: 7 or more consecutive points are either all above or all below the mean.
- Meaning: A shift in the process average.
3. Trend of 6 (or more) Consecutive Points Increasing or Decreasing
- Rule: 6 or more consecutive points show a continuous upward or downward trend.
- Meaning: A drift or gradual change in the process.
4. 2 out of 3 Points in Zone A (Near a Control Limit)
- Rule: Two out of three consecutive points fall within Zone A (beyond two standard deviations from the mean).
- Meaning: The process may be shifting toward an out-of-control state.
5. 4 out of 5 Points in Zone B or Beyond
- Rule: Four out of five consecutive points are within Zone B or closer to the control limits (beyond one standard deviation).
- Meaning: Increased variability in the process.
6. 15 Points in a Row within Zone C (Near the Mean)
- Rule: 15 consecutive points are within one standard deviation from the mean (Zone C).
- Meaning: The process might be over-controlled, or there’s reduced variability.
7. 8 Points Alternating Up and Down
- Rule: 8 consecutive points alternate between increasing and decreasing.
- Meaning: There may be an external factor influencing the process regularly.
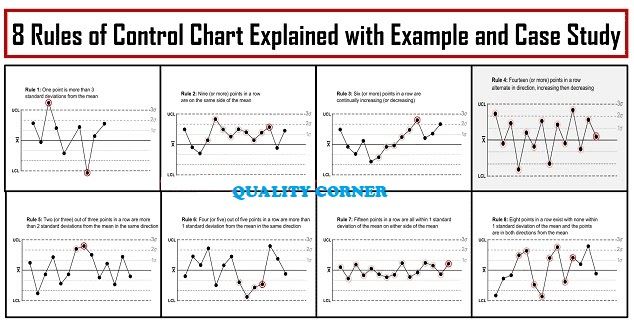
These rules help identify patterns that suggest something unusual in the process, prompting further investigation to correct issues before they affect quality or performance.
28. How to calculate CP,CPK,PP&PPK ?
Cp, Cpk, Pp, and Ppk are metrics used in process capability analysis to determine how well a process meets its specification limits.
1. Process Capability (Cp and Cpk)
These metrics are used when the process is stable and in statistical control. They provide insights into whether the process has the potential to meet specifications consistently.
Cp (Process Capability Index)
- Formula: Cp = (USL – LSL) / (6σ)
- USL: Upper Specification Limit
- LSL: Lower Specification Limit
- σ: Standard deviation of the process
- Interpretation: Cp measures the spread of the process relative to the specification limits. A Cp > 1 indicates that the process has a smaller spread than the specification range, meaning it has the potential to meet the specifications.
Cpk (Process Capability Index Adjusted for Centering)
- Formula: Cpk = min[(USL – μ) / (3σ), (μ – LSL) / (3σ)]
- μ: Mean of the process
- Interpretation: Cpk considers both the spread and the centering of the process. If Cpk < Cp, it indicates the process is off-center. A higher Cpk value shows the process is centered within the specification limits.
2. Process Performance (Pp and Ppk)
Pp and Ppk are used when the process is not necessarily stable or in statistical control, providing a snapshot of how well the process is performing.
Pp (Process Performance Index)
- Formula: Pp = (USL – LSL) / (6σ)
- Here, σ is calculated using the overall standard deviation, rather than just within a stable, controlled process.
- Interpretation: Like Cp, Pp measures the spread of the process compared to the specification limits, but it reflects the actual performance rather than ideal conditions.
Ppk (Process Performance Index Adjusted for Centering)
- Formula: Ppk = min[(USL – μ) / (3σ), (μ – LSL) / (3σ)]
- Interpretation: Similar to Cpk, Ppk considers both the spread and the centering of the process. However, it provides a real-time performance snapshot, considering any shifts or instability in the process.
Summary
- Cp and Cpk are used when the process is in control (ideal conditions).
- Pp and Ppk are used for processes that may not be stable, reflecting real-world performance.
Higher values (typically >1.33) for Cp/Cpk or Pp/Ppk indicate a capable process that consistently meets specifications.
These questions and answers provide a thorough understanding of SPC and capability analysis (Cp, Cpk, Pp, Ppk) essential for quality control in manufacturing. Understanding and applying these concepts can lead to improved process performance and product consistency.
- Top 15 MNCs Every Mechanical Engineer Dreams of Joining in 2025

- How to Digitize and Automate the CAPA Process

- Top 10 Essential Tools Every Mechanical Engineer Should Know

- What is GD&T (Geometric Dimensioning & Tolerancing) ?

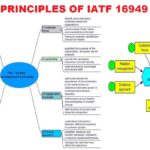
- Principles of IATF 16949: A Guide to Quality Management
- The Evolution of IATF 16949: The Automotive Quality Standard

- Top Interview Questions Related to SPC ,Cp and Cpk
- Difference Between Purchase and Procurement

- Master Your Job Interview: Top 70 Common Interview Questions and Answers

- What Is Standard Deviation ?

- Top Interview Questions and Answers on SPC
- Top 20 Interview Questions For Customer Quality Manager ?